
Introduction
In the previous post I covered inserting data into a PostgreSQL table; and we used the Lesson_004 files in the learning-data-science GitHub repository to create foreign keys in the public.sample table. In this post, Lesson 005, we’ll take a step back and prepare an Entity Relationship (ER) model for my_first_database. We’ll use the ER model in future posts to guide database development. Since data analysis and management are best learned by doing, the objective of this and future posts is to get readers hands on experience using PostgreSQL and R.
This lesson builds on earlier posts so, if this is your first time reading this blog and you’d like to follow along on your computer, then please go back and start from the post Learning Data Science and work through the lessons up to this point. For this post we’ll refer to files in the Lesson_005 folder in the learning-data-science repository. If you have not already forked the learning-data-science repository, and cloned the fork to your computer, please do so now following the instructions provided in the post Learning Data Science. If you have previously forked and cloned the repository, but don’t have the files for this lesson, then follow the instructions here to update your fork with the latest files.
If you are not familiar with version control using Git and GitHub, I recommend going back and working through the hands on tutorials in my series on version control starting with “Version Control: An Overview.
The Data Pipeline
We’re gonna start out with a flashback to the data pipeline and the first several posts in this blog series. If you haven’t read the first few posts I recommend going back and starting with the post The Data Pipeline: Planning and reading the next five posts through The Data Pipeline: Metadata & Archiving. As a quick reminder Figure 1 shows the seven stages of the data pipeline.
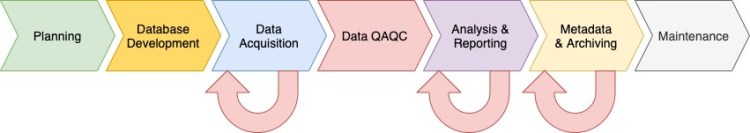
In the Planning phase the data stewards and managers work together to develop a timeline and identify the resources, including adequate funding, personnel, and infrastructure, required to complete the remaining six stages in the data pipeline. The centerpiece of this stage is the Data Management Plan which includes a data model. In the Database Development phase the data stewards and managers, guided by the data model, work with those who will be involved in the Data Acquisition phase to develop the database. The data model can be represented by an Entity Relationship (ER) model.
Entity Relationship Models
In data management ER models are based on two concepts: 1) Entities, defined as tables and columns that hold specific information (data), and 2) Relationships, defined as the associations or interactions between entities (Watt and Eng 2014). A simple ER Model illustrating a foreign key relationship between a data table and a domain table is displayed in Figure 2.

In Lessons 1-4 we created my-first-database, created a schema and tables, inserted data into the tables, and set up a foreign key relationship. However, we haven’t yet discussed the purpose of the database beyond treating it as a learning mechanism. Here we formalize the purpose of the database which will drive the database structure, and we’ll create an ER model which includes two additional data tables and several more domain tables to manage site and vegetation structure data.
Entity Relationship Diagrams
The purpose of my-first-database is to store vegetation relevé plot data and associated environment data for use in vegetation classification and mapping efforts. Currently my-first-database has one data table, the sample table, and two domain tables, dom_study and dom_sample_type. The sample table contains a list of plots with a unique study_value and sample_id and the location of the plots stored in the latitude_dd and longitude_dd columns. However, we need my-first-database to also store site and vegetation structure data. One way to express this in an ER Model is to create an ER diagram that shows the tables and columns and relationships between them (Figure 3). Is the Figure 3 text too small to read? Click here to view the ER Diagram in Google Drive
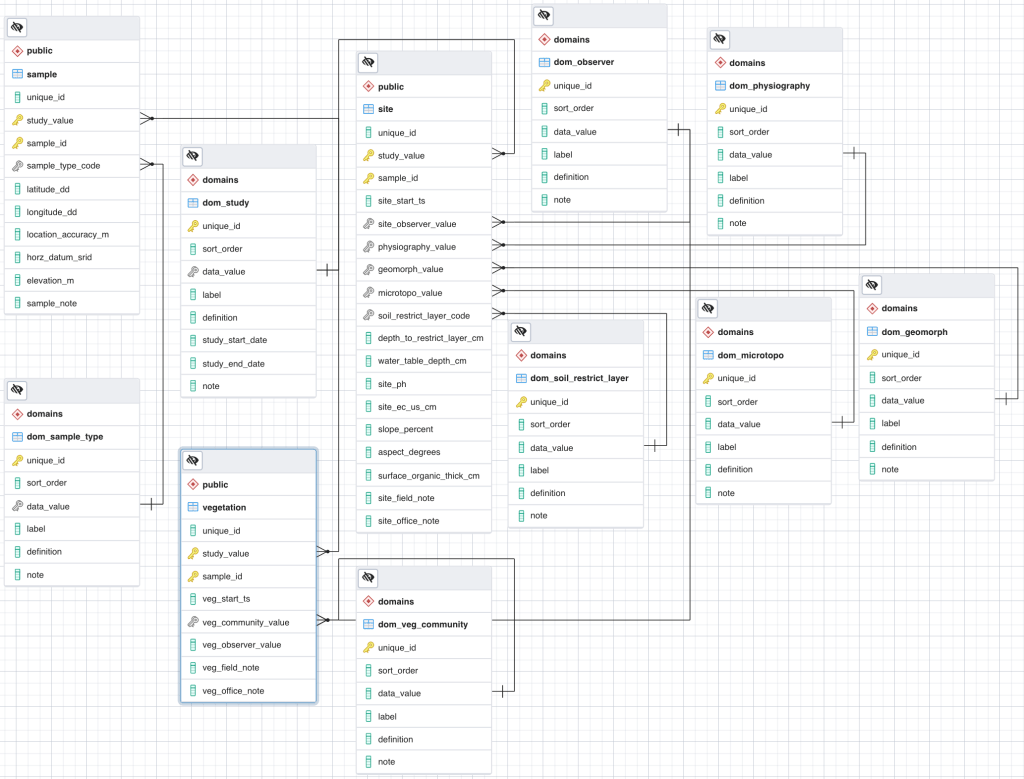
The ER Diagram Figure 3 shows each table in a block, including schema name, table names and column names. Various icons illustrate the primary (yellow key icon) and foreign (gray key icon) keys, and the lines illustrate the columns related via a foreign key constraint. The lines with a cross on one end and fork on the other indicate a one-to-many foreign key relationship. As you build your database model the ER diagram will grow in complexity as you add as many tables and the linkages between them as necessary to meet your objectives.

Figure 4 displays a portion of the ER diagram from Figure 3 for readability. You can see the foreign key constraints on the study_value and sample_type_code columns in sample table that we created in Lesson 4. You can also see that the study_value and sample_id columns are part of the primary key for the sample table. These diagrams were created using the Beta Version of the Entity Relationship Diagram (ERD) tool in pgAdmin 4. However, you can use any kind flow chart software (e.g., Lucid Charts) or even use pencil and paper sketches to create an ER diagrams.
However, an advantage of the ERD tool in pgAdmin is that once you build your ER diagram you can download a file that contains the SQL to create the tables and database relationships from your ERD. Note that as of the writing of this blog the pgAdmin ERD tool is still in it’s early stages of development.
Entity Relationship Table
An ER digram can be useful for visualizing the database structure and relationships between tables and columns. Another approach to creating ER models is to create an Entity Relationship table. An ER table can be created in a spreadsheet and contains all of the information about the database (e.g., schemas, tables, columns, primary keys) and the relationships therein (e.g., foreign keys). For advanced programmers, an ER table can used to create a PostgreSQL database programmatically using R or Python. An ER table that matches the structure of the ER Diagram in Figure 4 is presented in Table 1, below.
Notice the “comment” columns (e.g., column comments) in the above spreadsheet. The comment columns contain descriptions of each database element which is an essential part of the database metadata. As you develop your data model sure to take the time to write these descriptions as it will set you up for success in the later stages of the data pipeline (e.g., metadata and archiving) and provides essential information about the database to all database users.
From Data Model to Database
When your data model is complete I recommend reviewing it carefully to ensure the design will be adequate to meet the purpose of the database. Review the data acquisition protocols against the data model to ensure the database contains all of the elements necessary to store the data that will be acquired and that the relationships between the elements are properly defined. Also, be sure to reach out to all those who will be using the database to get their feedback. At the outset it can be challenging to envision all of the needs that the a database will need to meet in the future. However, a well designed data model is sufficiently specific to meet the current needs for data storage while also being flexible enough to adapt to future data storage needs. The completed data model will serve as the road map for database development.
” A well designed data model is sufficiently specific to meet the current needs for data storage while also being flexible enough to adapt to future data storage needs.”
Elfinwood Data Science
When the data model is complete the next step is translate the data model into SQL statements to create the database structure specified in the ER diagram or table. To this end I’ve prepared a SQL script (create_tables_script_for_my_first_db.sql) that contains the code necessary to create the database structure outlined in Figure 3 and Table 1. The SQL script is available in the Lesson 5 folder in the learning-data-science repository. Please review the script in the Lesson 5 folder. We will wait to run the script until the next lesson.
Recommended Reading
As a supplement to this post, I encourage you to read Chapter 8 The Entity Relationship Data Model in Database Design 2nd Edition by Adrienne Watt.
Literature Cited
Watt, A. and N. Eng. (2014). Database Design – 2nd Edition. Victoria, B.C.: BCcampus. Retrieved from https://opentextbc.ca/dbdesign01/
Next Time on Elfinwood Data Science Blog
In this post, we took a step back and reviewed the data pipeline, prepared an Entity Relationship (ER) model for my_first_database, and reviewed a script that represents a translation of the data model into SQL for creating the database tables, columns, and foreign and unique keys. In the next post we’ll learn about SQL statements, run the SQL script in the Lesson 5 folder to the create the database tables and columns in my-first-database, import data into the tables, and create a SELECT statement.
If you like this post then please consider subscribing to this blog (see below) or following me on social media.If you’d like to follow this blog, but you don’t want to follow by subscribing through WordPress then a couple of options exist. You can “Like” the Elfinwood Data Science Blog Facebook Page or send me your email using the form on the Contacts Page and I’ll add you to the blog’s email list.
Follow My Blog
Copyright © 2021, Aaron Wells

One thought on “Lesson 005: Entity Relationship Models”