
Introduction
In the previous post I provided an overview of the Quality Assurance and Control (QAQC) stage of the data pipeline (Figure 1). In this post I’ll provide an overview of the data Analysis and Reporting stage. By this point you have developed a database system, acquired data, and performed QAQC review on the data.
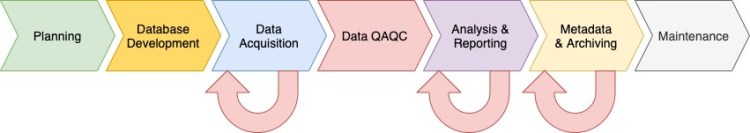
In the analysis and reporting stage, the data you’ve acquired are analyzed to look for patterns or trends using statistical software, and the results are presented and synthesized in a report or peer-reviewed manuscript. Elements of the data QAQC stage carry over into analysis and reporting as indicated by the red arrow in Figure 1. For instance, while performing data analysis you may encountered errors in the data that were missed in the QAQC stage and that need to be addressed in the database. Below, I’ll briefly discuss the important elements of analysis and reporting as they pertain to data management, including analysis software, database integrations, data flow, version control, reproducible research, and automated reporting workflows.
Data Analysis
Data analysis software options are many, and range from simple spreadsheets, to full-fledged statistical software like the R Project for Statistical Computing, Python, and SAS. Spreadsheets can be an easy way to get started with data analysis, but are limited in the scope of analyses that be performed. Spreadsheets also can’t be as readily integrated with a database or incorporated into more sophisticated reporting workflows (see below) as can programs like R.
Integrating data analysis with your database system has several advantages. First, unlike using spreadsheets for analysis, which can be prone to versioning issues, the database provides a permanent record of where the data came from for your analyses. Second, if you are using a server database like PostgreSQL, then the database can be shared through the internet with people on your team. This will set your team up for success by allowing simultaneous database assess, thus eliminating data versioning issues. Third, as you work through your analysis, if you encounter data errors that were missed in the QAQC stage those errors can be fixed in the database, and then the data refreshed in your statistical software. With a direct connection to your database those data changes will cascade from the database directly to your analysis, and you’ll always be certain that you’re using the most recent version of your data. R packages like ‘RPostgreSQL‘ provide tools for connecting R to a PostgreSQL database to simplify and streamline data analysis.

Figure created by Aaron Wells and Christopher Swingley in R using the ggplot2 R package.
Version control is another element of good data analysis practices. By using a version control system like git, combined with an online code repository like GitLab or GitHub, you and your team can seamlessly manage data analysis and reporting code, and keep a continuous record of your progress. Reproducible research refers to the practice of keeping the code and data used in analyses with the manuscript text, along with annotations regarding the analyses, to allow researchers to reproduce the results presented in the manuscript (Gentleman and Lang 2007).
“By reproducible research, we mean research papers with accompanying software tools that allow the reader to directly reproduce the results and employ the computational methods that are presented in the research paper.”
Gentleman and Lang 2007
Even if you’re not publishing your work in journals and sharing your research widely, practicing reproducible research is advantageous for yourself and your team by allowing you to easily share your analysis code and annotations, and keep a record of your work. Common tools used for reproducible research include R Notebooks or Jupyter Notebook. Using a version control system combined with reproducible research tools also allows you to share your work with colleagues who can then create their own branch of the code, and reproduce the analyses you’ve performed on their own datasets. I’ll cover version control and reproducible research in more detail in future blog posts.
Reporting
Early in my career, one of my favorite pieces of advice that I received regarding reporting was to save the writing for last. Rather than beginning by writing, the best way to approach tackling a manuscript is to:
- Begin by listing out the tables, figures, and appendices that support your thesis and that will be included in your manuscript,
- Prepare the tables, figures, and appendices, and
- Start writing!
By approaching reporting using the above steps the initial focus is on the data, which forms the foundation for your thesis, and the raw materials for constructing the tables, figures, and appendices. Integrating your database system into the reporting process, and introducing reproducible research practices, can help streamline reporting and provide a record of the data and code used to prepare the core elements of the report. For instance, database views (i.e. saved queries) can be used to prepare summary tables for the report, and the code used to produce report figures can be stored in an R or Jupyter Notebook.
In advanced reporting workflows, manuscript production can be semi-automated by integrating code blocks, text, and a type setting system such as Markdown or LaTeX, within an R or Jupyter Notebook, to produce publication ready documents with the push of a button. In this workflow the data flows directly from the database system, into the analysis software, and the text, figures, and tables are rendered and formatted. I’ll cover semi-automated reporting workflows in more detail in a later post.
Next Time on Elfinwood Data Science Blog
In this post I provided an overview of stage 5 in the data pipeline: Analysis & Reporting. In the next post I’ll provide an overview of metadata and archiving, stage 6 of the data pipeline. If you like this post then please consider subscribing to this blog (see below) or following me on social media.
Literature Cited
Gentleman, R. and Lang, D.T. 2007. Statistical Analyses and Reproducible Research, Journal of Computational and Graphical Statistics, 16:1, 1-23, DOI: 10.1198/106186007X178663
Follow My Blog
Get new content delivered directly to your inbox.
Copyright © 2020, Aaron Wells

One thought on “The Data Pipeline: Analysis & Reporting”